03 / Enterprise productAT&T · 2019 to 2020
Network intelligence
Making an invisible system easier to understand.
A proactive network health experience that helps customers see what is wrong, understand why, and know what happens next.

RoleUI product designer
ScopeResearch synthesis, concepting, prototyping
PartnersService design, research, product
OutcomeA proactive network-health vision
01 / The service problem
Customers could feel the problem. They could not see the system causing it.
Half of AT&T Fiber customers experienced a troubleshooting incident. The path to resolution changed depending on how they reached support and which technology served their home.
We set out to create a low-effort experience that could anticipate issues, solve the problem correctly, and assure customers that it would stay solved.
50%Experienced an incident
71%Reported a negative resolution
4.3%Higher incremental churn
02 / Find the unmet need
The quietest customers carried the clearest signal.
Research showed that many customers lived with recurring broadband issues without contacting AT&T. They expected support to take too long, require too much effort, or fail to resolve the root cause.
Primary archetypeThe Silent Sufferer
“I experience these issues daily. I do not call because it feels like a waste of time.”
03 / Open the problem
We turned research into a room full of possibilities.
A concept jam brought the core team and stakeholders together around the root causes. We generated idea seeds, clustered them into themes, ranked value and feasibility, and shaped the strongest ideas into storyboards.
120Idea seeds
9Opportunity themes
6Concepts tested
200Research participants
04 / Build the north star
A journey blueprint connected every service moment.
We mapped what a customer does, what the network is doing, where support enters, and which screen carries the next decision. That blueprint gave the team a shared view of the ideal broadband experience before we committed to detailed UI.
Detect
Monitor the network before the customer has to ask.
Explain
Translate diagnostics into clear, human language.
Resolve
Guide the right action or schedule support directly.
Remember
Preserve history so the customer never starts over.
05 / Network Health Dashboard
One view of what is happening at home.
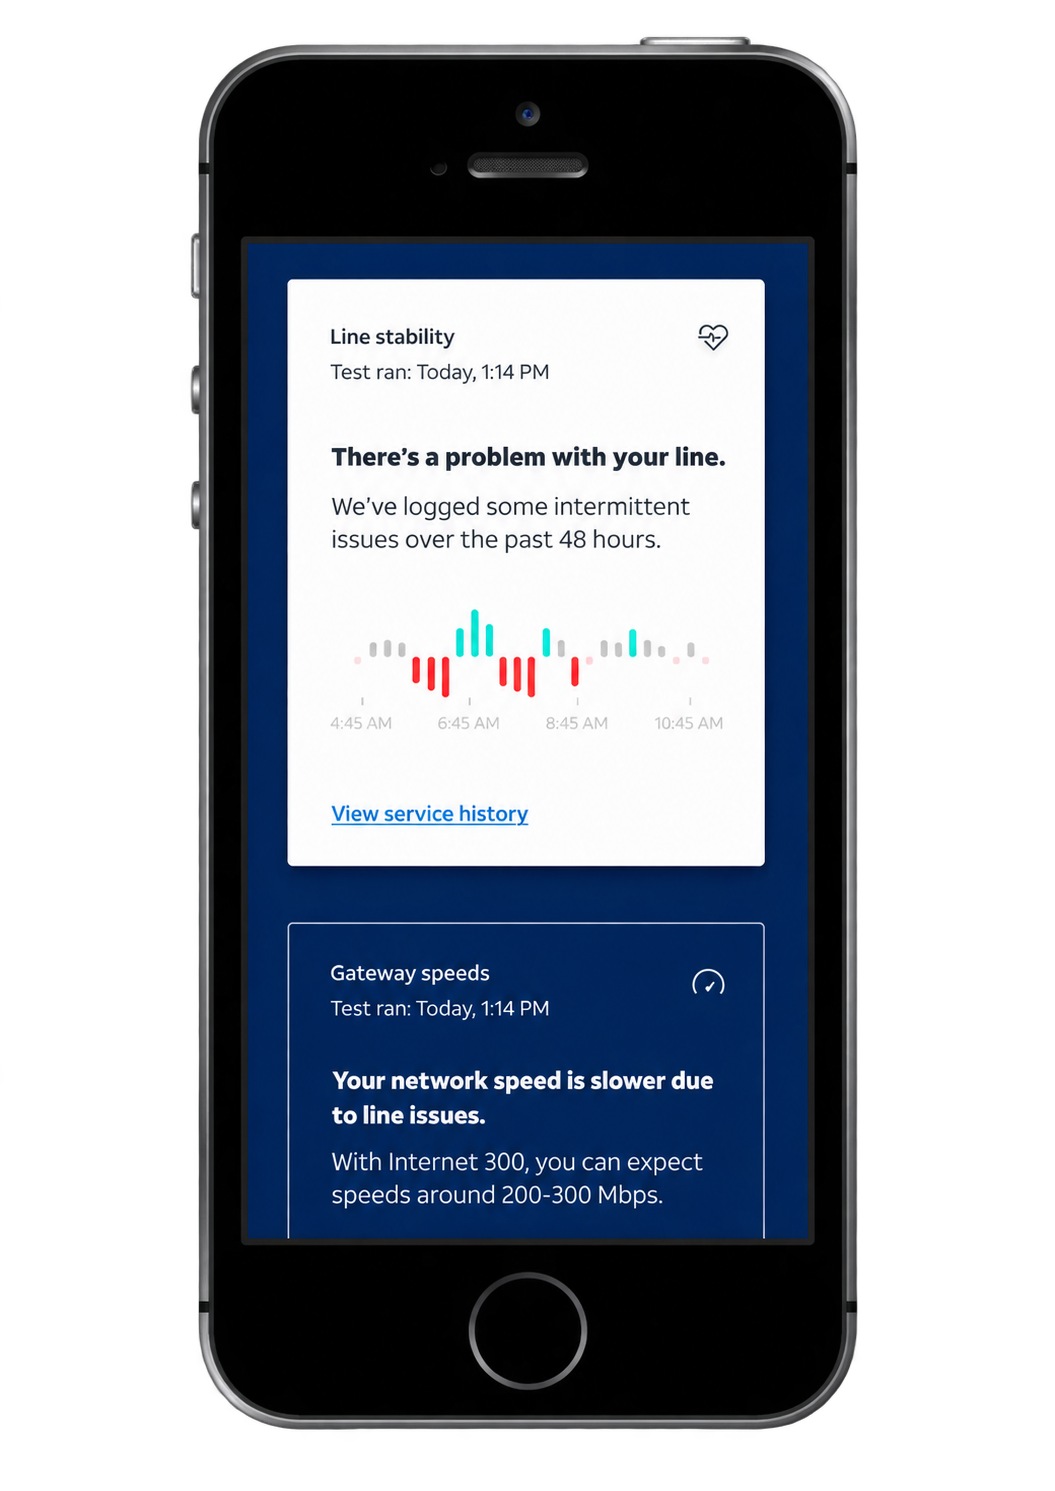
The dashboard breaks the network into three components, in the order they operate. Customers can see performance at a glance, understand which layer is responsible, and move directly to the right next step.
01
Line stability
Service entering the home02
Gateway performance
Speed delivered by the plan03
Device connectivity
Coverage and bandwidth by device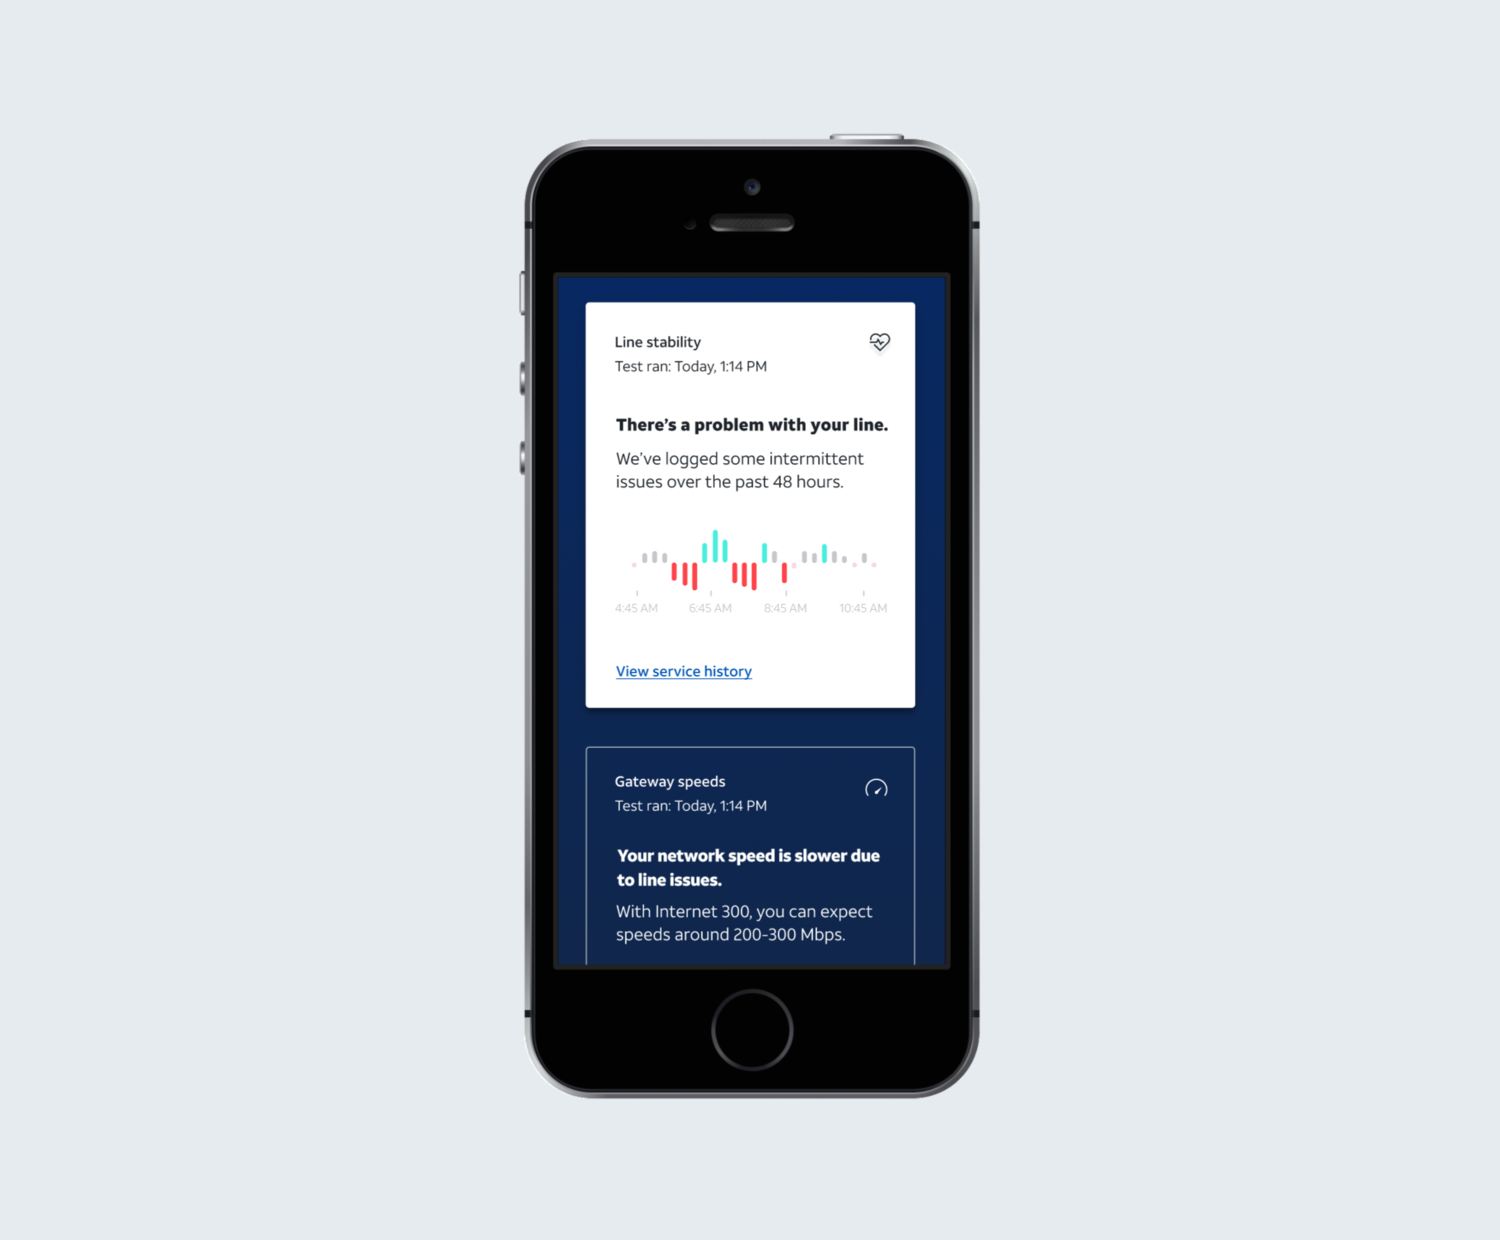
06 / Close the loop
The experience remembers what support already learned.
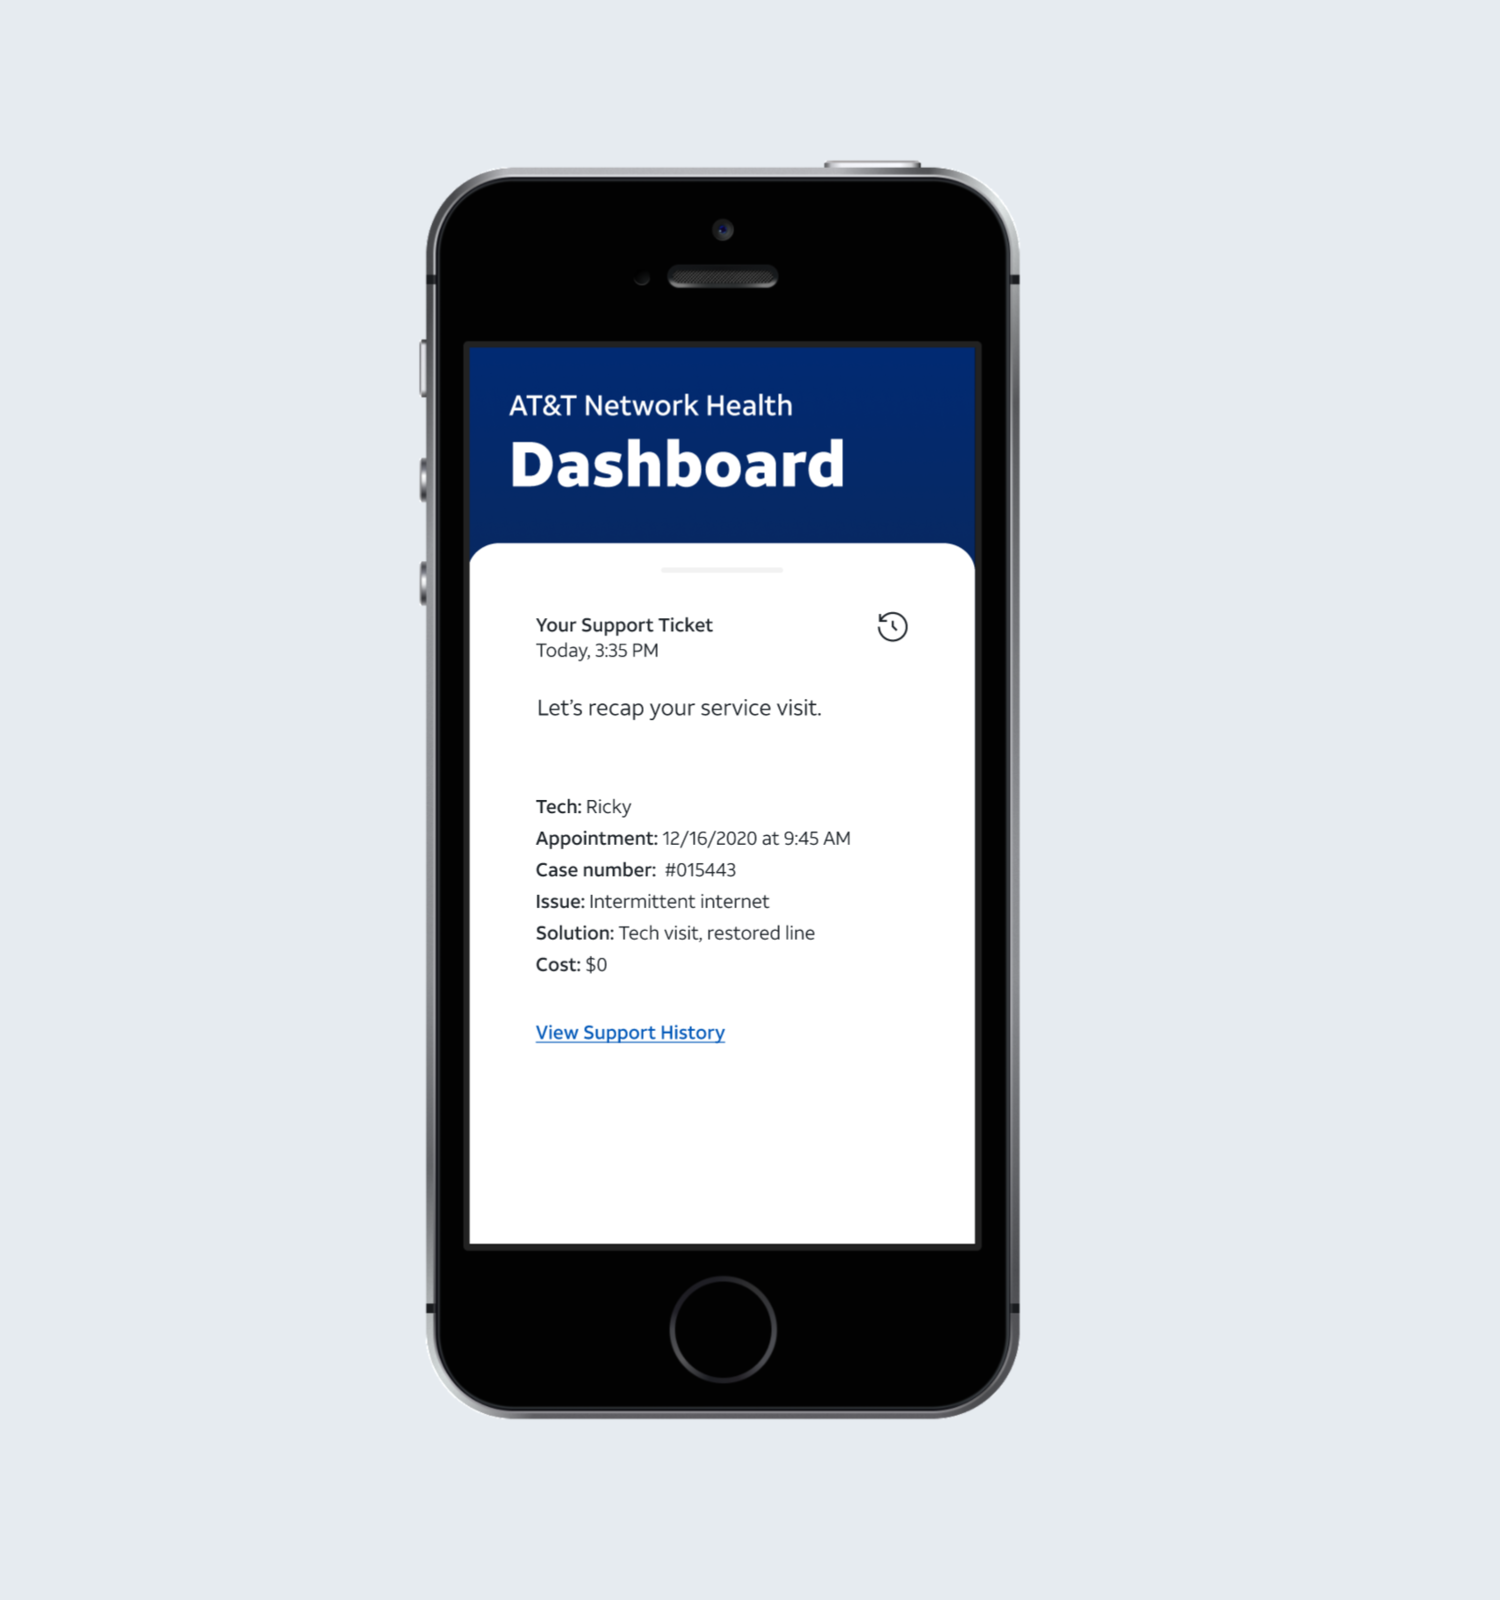
Jacqueline sees intermittent line issues, reviews the diagnostic history, and schedules the right support without repeating every detail.
After the visit, the dashboard records the technician, issue, resolution, cost, and case number. The system carries context forward instead of placing the burden back on the customer.
Three takeaways
Show the invisible.
Clear system status gives customers language for a problem they can feel but cannot diagnose.
Design before the call.
Proactive monitoring can resolve frustration before it becomes a support interaction.
Carry context forward.
Service history turns each resolution into knowledge the system can use next time.